Outbound TAM Sizing in 2026: How to Calculate the Account Coverage Your Pipeline Target Needs
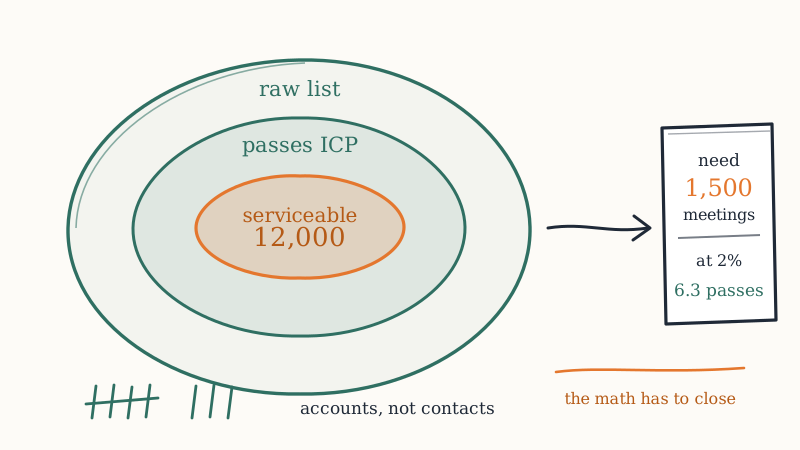
Most outbound programs that fail do not fail on copy. They fail on arithmetic that nobody did before the sequences went live.
The pattern is consistent. A team sets a pipeline number, picks an ICP, buys a data tool, builds a list, and starts sending. Six months later reply rates look normal, the sequences are fine, the reps are working, and the number is still missing by half. The post-mortem blames messaging, so the team rewrites the emails. The emails were never the problem. The problem was that the market they defined was never large enough to produce that many meetings at any believable conversion rate, and the plan had no way of knowing that in advance.
Outbound TAM sizing is the arithmetic that answers the question before you spend the year finding out. Not the investor-deck version of TAM, which is a dollar figure nobody can act on. The operator version: how many real accounts can you contact, how many times can you contact them, and does that produce the number of meetings your target requires.
At GroomLead we run this calculation before we build a single list, because it is the one input that determines whether an outbound plan is a plan or a wish.
Short answer
Outbound TAM sizing means converting your market into a count of contactable accounts and then checking that count against the meetings your pipeline target needs. Do it in two directions.
Top down: start with every account that matches your firmographics, then subtract everything that makes an account unworkable (wrong size, no reachable contacts, already a customer, in an open deal, on a suppression list). What survives is your serviceable outbound market, measured in accounts.
Bottom up: take your revenue target, divide by average contract value to get required wins, then divide back through win rate, meeting-to-opportunity rate, show rate, and account-to-meeting rate. That gives you the number of account-touch cycles the year demands.
If the second number exceeds the first by more than roughly four to six times, your plan does not close on outbound alone, and no amount of copy iteration fixes it. You have to change the ACV, the conversion rates, the ICP boundary, or the channel mix.
TAM, SAM, and the number that actually matters
The classic framing is three circles: total addressable market, serviceable addressable market, serviceable obtainable market. It is useful for fundraising and nearly useless for sequencing, because every layer is denominated in dollars and outbound is executed against accounts.
Rewrite the layers in units you can send to:
| Layer | Unit | What it answers |
|---|---|---|
| Total addressable market | Dollars | Is this market worth building a company in |
| Matching account universe | Accounts | How many companies look like a customer on paper |
| Serviceable outbound market | Accounts with reachable contacts | How many companies can we actually start a conversation with |
| Annual touch capacity | Account-touch cycles | How many conversation attempts does that allow per year |
The last two are the only ones that constrain an outbound plan. A $12B TAM with 900 reachable accounts is a small outbound market wearing a large suit. A $400M TAM with 40,000 reachable mid-market accounts is a large outbound market that looks unimpressive on a slide. Outbound planning cares about the second one.
The shrinkage table: raw list to serviceable market
Here is the part most teams skip. A data platform returns a count, the count looks large, and nobody subtracts. Every filter below is a real reduction, and the compounding is brutal.
Worked example for a team selling a $50,000 ACV product to mid-market operations teams in North America:
| Filter | Accounts remaining | What was removed |
|---|---|---|
| Industry and geography match | 48,000 | Starting universe from firmographic match |
| Employee count 200 to 2,000 | 24,500 | Too small to afford it, too large for the sales motion |
| Has the operational trigger (owns a physical supply chain) | 18,200 | Industry codes overstate fit constantly |
| At least two verified, reachable contacts in the target function | 13,400 | No deliverable contact data means no outbound, regardless of fit |
| Minus existing customers, open opportunities, partners, suppression | 12,000 | Already in play or legally off limits |
Serviceable outbound market: 12,000 accounts.
That is a 75% reduction from the number the data tool showed on day one, and every step of the reduction is defensible. The two filters teams most often forget are the contact-data filter and the suppression filter. An account with no reachable human is not a prospect, it is a row. And an account already sitting in an open opportunity getting cold-sequenced is an active liability, not an addition to coverage.
A note on the contact-data filter: it degrades constantly. Contacts change jobs, titles get restructured, and the verified-contact count you measured in January is smaller by June. This is why sizing has to be re-run rather than done once, and why the enrichment layer is load-bearing rather than cosmetic. Automated enrichment and hygiene (Clay plus AI, in our case) exists specifically to keep the serviceable count from quietly eroding under the plan that depends on it.
Count accounts, not contacts
The single most common sizing error is denominating the market in contacts, because contact counts are bigger and bigger feels safer.
It is the wrong unit for three reasons.
Buying happens at the account. Five contacts at one company are one opportunity, not five. A list of 60,000 contacts across 9,000 accounts is a 9,000-account market, and reporting it as 60,000 inflates the plan by nearly seven times.
Fatigue accrues at the account too. Sequence four people at the same company in the same week and you are not running four independent experiments. You are running one noticeable campaign, and the reputational cost lands on the domain and the company’s spam filters jointly.
Contact depth is a coverage decision, not a market-size decision. Multithreading across the buying committee raises your conversion per account, which is a different lever from having more accounts. Treat it as a conversion multiplier in the math below, not as market expansion.
So: size in accounts. Then record contacts per account as a separate figure, because it becomes an input to your touch model, not to your market size.
Bottom up: the coverage math
Now work the other direction, from the revenue target back to required account touches. Same company as above.
| Step | Rate | Result |
|---|---|---|
| New ARR target | $6,000,000 | |
| Average contract value | $50,000 | 120 new customers needed |
| Opportunity win rate | 25% | 480 qualified opportunities |
| Meeting-to-opportunity conversion | 40% | 1,200 meetings held |
| Meeting show rate | 80% | 1,500 meetings booked |
| Account-to-booked-meeting rate per touch cycle | 2% | 75,000 account-touch cycles required |
The final row is the one that decides everything. Against a serviceable market of 12,000 accounts, 75,000 required touch cycles means contacting every account in your market 6.3 times per year, which is once every eight weeks, every account, with no gaps and no decay in response.
That is not a plan. It is a treadmill that erodes its own conversion rate as it runs, because the sixth cold approach to the same account in twelve months does not convert at 2%. It converts at a fraction of that, which means the real requirement is higher than 75,000 and the gap is worse than it looks.
Here is the honest conclusion the table produces: this plan does not close on cold outbound alone. Finding that out in a spreadsheet in January costs an afternoon. Finding it out in Q4 costs the year.
Reading the coverage ratio
Divide required touch cycles by serviceable accounts. That ratio is the fastest diagnostic in outbound planning.
| Coverage ratio | Interpretation | What to do |
|---|---|---|
| Under 2x | Comfortable. Room to be selective and to run tight ICP filters | Tighten targeting, raise personalization depth |
| 2x to 4x | Workable. Standard quarterly cadence with signal-based prioritization | Build the signal layer, sequence the top tier first |
| 4x to 6x | Tight. You are close to saturating the market annually | Raise conversion per touch, add channels, widen ICP carefully |
| Over 6x | Does not close. The arithmetic is telling you the strategy is wrong | Change ACV, conversion, ICP boundary, or mix. Do not just send more |
Most teams discover they are in the last two rows, and most respond by increasing send volume, which is the one lever that makes the ratio worse rather than better. Volume does not expand a market. It consumes it faster.
The five real levers when the math does not close
In order of how quickly they move the number.
1. Raise the account-to-meeting rate
This is the highest-leverage lever and the least used, because it is the hardest to fake. Going from 2% to 4% halves the required touch cycles, which takes the example from a 6.3x coverage ratio to 3.1x. Nothing else moves the number that far.
What actually lifts that rate is timing rather than wording. The same message to the same account converts at wildly different rates depending on whether something just changed there. A new executive in the function you sell to, a competitor relationship forming, a hiring burst in the relevant team, a visit to your pricing page: each of those turns a cold account into a warm one without changing your market size at all.
This is the entire reason to run a signal layer rather than a static list. CAM does exactly this, turning job changes, social listening, competitor connections, and website activity into lead lists, so the accounts you touch this week are the subset of your market where something just moved. Your serviceable market stays at 12,000, but you stop spending the year contacting all 12,000 at random and start contacting the 400 per month that have a reason to answer.
2. Stop leaking the meetings you already earned
Look at the show rate and the meeting-to-opportunity rate in the table. At 80% and 40%, the plan needs 1,500 booked meetings to produce 480 opportunities. Push the show rate to 90% and the conversion to 50% and the same 480 opportunities need only 1,067 booked meetings, which cuts required touch cycles by 29% without adding one account.
A large share of that leakage happens in the reply window. A prospect who answers a cold email is interested for a short, measurable period, and a reply that sits unhandled for six hours converts far worse than the same reply handled in five minutes. The failure is structural rather than lazy: outbound at scale means replies landing across many sending accounts, and nobody can watch twelve inboxes attentively.
Underfive.ai addresses that directly, giving you a unified inbox for every sending account with AI inbox agents that label replies, draft responses in under five minutes, and book meetings. In coverage terms it is a conversion multiplier applied to traffic you have already paid for, which is cheaper than any form of market expansion.
3. Raise ACV or expand the deal
Required wins is revenue divided by ACV, so ACV sits at the top of the whole cascade. Moving from $50,000 to $65,000 drops required wins from 120 to 93 and takes required touch cycles from 75,000 to about 58,000. That is a 23% reduction in coverage pressure from a pricing and packaging decision, not an outbound decision.
This is why sizing should be a joint exercise with whoever owns pricing. An outbound plan that does not close at the current ACV sometimes closes at a higher one aimed at slightly larger accounts, even though the account count goes down.
4. Widen the ICP deliberately, one adjacency at a time
Expansion is a legitimate lever and the most frequently abused one. The discipline is to add one adjacent segment, size it separately, and sequence it as its own cohort with its own conversion tracking.
Good adjacencies share the trigger and differ on a surface attribute: the same operational problem one employee band up, the same function in a neighbouring industry, the same profile in a second geography. Bad expansion deletes a filter from the query because the count was too small, which adds accounts that look like your ICP in a database and behave nothing like it in a sales cycle. The second kind shows up as a modest lift in meetings and a collapse in win rate two quarters later.
5. Add channels to multiply touch cycles without multiplying accounts
A touch cycle does not have to be an email. Email, LinkedIn, and phone against the same account in the same window is one coordinated approach with a materially better chance of connecting than email alone, which raises the account-to-meeting rate rather than the account count.
LinkedIn is the most underused capacity here, especially at the volumes an InMail-based system can sustain. Running 10,000 or more targeted DMs per month against a 12,000-account market is a materially different coverage picture than the same market reached by email only.
When your market is genuinely too small
Sometimes the answer is that the serviceable market is 900 accounts and the target requires 40,000 touch cycles. No lever bridges that. What works instead:
Switch from coverage to depth. With under roughly 1,000 accounts you are not running outbound, you are running account-based selling with outbound tooling. Fifteen contacts per account, researched approaches, multi-quarter persistence, and real executive involvement. The unit of work becomes the account, not the send.
Count the same account more than once. Large organisations are several buying centres. A 900-company market with four independent buying units each is a 3,600-opportunity market, and the division between them is usually geography, business unit, or product line.
Monitor rather than sequence. With a small finite market, the right posture is to watch all of it continuously and approach only on movement. You cannot out-volume a small market, but you can out-time everyone else in it.
Treat the installed base as market. Expansion, cross-sell, and lost-deal reactivation are all account inventory that never appears in a TAM query, and in small markets they often exceed the net-new opportunity.
Who owns this number, and how often to re-run it
Sizing goes stale in three ways: contact data decays, the market itself moves, and your own conversion rates drift as the program matures. A number calculated in January and trusted in September is a liability.
A practical cadence:
- Monthly: re-pull the reachable-contact count on your existing account set. If verified contacts per account are falling, your serviceable market is shrinking even if the account count holds.
- Quarterly: re-run the full coverage math with your last 90 days of actual conversion rates rather than the planning assumptions. This is where plans get corrected while there is still time to correct them.
- Annually, or on any ICP change: rebuild the shrinkage table from the raw universe up.
Ownership should sit with whoever owns the data layer, typically sales ops or GTM engineering, not with the team sending the sequences. The people whose quota depends on the market being large enough should not be the people estimating how large it is.
Five mistakes that break the calculation
- Sizing in contacts rather than accounts. Inflates the market by whatever your average contacts-per-account happens to be, which is a multiple rather than a rounding error.
- Skipping the reachable-contact filter. Produces a market full of accounts you cannot actually start a conversation with, and a plan that silently assumes you can.
- Using planning conversion rates instead of measured ones. Everyone’s planning assumptions are optimistic. The second quarter of real data is the only honest input.
- Forgetting suppression and in-play accounts. Overstates the market slightly and creates real damage when a cold sequence hits an account mid-negotiation.
- Responding to a bad ratio with more volume. The ratio is a statement about market size and conversion. Volume changes neither, and it burns domain reputation while consuming the market faster.
Frequently asked questions
How do I size an outbound TAM without an expensive data platform? Build the count from a sample. Take 200 accounts you can verify by hand against your ICP filters, measure what share pass each filter, then apply those pass rates to the raw universe count. A sampled estimate with honest filters beats a precise count with no filters, and it costs an afternoon rather than a subscription.
What is a realistic account-to-meeting rate to plan with? For genuinely cold, well-targeted outbound to a fitting account, somewhere between 1% and 3% of accounts touched per cycle producing a booked meeting is a common planning range, but treat that as a placeholder to be replaced rather than a benchmark. The only rate worth planning with is your own, measured over your last two quarters. Signal-triggered outbound to accounts where something just changed should run higher than your cold baseline, and you should verify by how much in your own data rather than assuming a multiplier.
Should I include accounts with no verified contact data in my TAM? Not in the serviceable outbound market, which is the number your plan runs against. Track them separately as an enrichable backlog, because some share of them become reachable later and that recovery rate is a useful metric on its own.
How many times can I contact the same account in a year? As a planning ceiling, three to four distinct approaches per year with meaningful gaps between them, assuming each approach has a new reason to exist. Beyond that, response decays and the brand cost starts to exceed the pipeline value. Signal-triggered contacts are the exception, because a contact tied to a real change at the account reads as relevant rather than repetitive.
Is outbound TAM the same as my sales territory? No. A territory is an assignment of a market to a rep, and it is a capacity question. Sizing is a market question, and it has to be answered first, because carving 12,000 accounts across six reps is a different exercise from discovering that 12,000 was never enough to begin with.
What if my coverage ratio says the plan does not close but leadership has already committed the number? Present the arithmetic with the levers attached rather than the objection alone. The useful version is: at current ACV and conversion rates this target requires 6.3 annual passes through the entire market, and here are four changes that each move it, with the expected effect of each. A ratio with options is a planning document. A ratio without options is a complaint.
Does a small serviceable market mean outbound is the wrong channel? Not necessarily, but it changes what outbound means. Small markets reward monitoring, timing, and depth per account. Large markets reward systems, volume discipline, and conversion efficiency. The mistake is running a large-market playbook against a small market, which saturates it in two quarters and leaves nothing to work with.
The spreadsheet is the cheapest thing you will build this year
Outbound is often described as a copy problem, a data problem, or a deliverability problem. Underneath all three sits an arithmetic problem that determines whether solving the other three can possibly be enough.
Two numbers, honestly derived: how many accounts can you really contact, and how many contact cycles does your target really require. Their ratio tells you whether this year’s plan is executable before you spend the year executing it. It takes an afternoon, it needs no tooling, and it is the only part of outbound planning where being pessimistic early is strictly cheaper than being optimistic late.
If you would rather have the sizing, the enrichment, the signal layer, and the reply coverage built and run as one system, GroomLead does that on pay-per-lead pricing with no retainer and no ramp time. Book a call and bring your current target number. We will run the coverage math with you on the call.
Ready to engineer your own GTM system?
GroomLead engineers outbound systems for B2B teams, and builds the tools inside this post.
Book Strategy Call